The April Gold succumbed to a decline to $1187.00 after this week's Fed meeting where plans to taper were presented. Gold has definitely not had a bright 2013. Long-term projections may still be extremely good following the paper instruments. Paper may eventually be challenged as one day it may be disclosed what supports the paper. For now, Gold holdings in the SPDR Gold Trust (NAR:GLD) has decreased by about 40 %. India has blocked imported Gold by their import tax increases. China is rather clever as buyers, not really disclosing their numbers readily. Perhaps they are buying on the lows and holding as the country has backed away from the US Dollar and other US assets. The central banks had been strong buyers of Gold, but it will be interesting to see if they hold or fold during this dip!
The real GDP today did not disappoint at 4.1 %! The GDP is made up of about 70 % consumer spending and is one of the broadest measures of estimates for the US economy covering about every sector. US President Obama stated at a Washington conference that "We head into next year with an economy that's stronger than it was when we started this year," boasting of the progress made during this difficult economic passage. Clearly the "irrational exuberance" previously referred to in the economic community may be rational as the data so far supports expansion. It is thought that the Fed may possibly reduce the stimulus by about $10 billion at each of the consecutive seven meetings of 2014 as long as the economy continues to flourish. The transparency that the Fed wanted to offer the consumers may even provide more certainty and confidence to the marketplace. The Fed still stands by tapering and not tightening vowing to keep interest rates low even perhaps at their target rates. The Fed had spoken of potentially withdrawing the stimulus when the Unemployment reaches 6.5 % and/or the inflation hits 2.5 %. Well 7.0 % is not quite the 6.5 %, but it is getting close. Inflation may be more of a concern. While the Fed clearly states that tapering is not tightening, often the two do go hand in hand. Inflation is under the Fed's goal of 2 % allowing for a highly accommodative stance. The unemployment numbers are important, but there are concerns that some or many of the no longer working have just dropped out of the surveys. The JOLTS report which monitors the hired and those that quit will be viewed more closely. The Fed remains bullish on the economy and will remain supportive. While the Fed does not have market interest per se, they do care about the consumer, and the market moves do trickle down to the consumer through a variety of means. US Fed Chairman Ben Bernanke steps down from office on January 31st and Janet Yellen is preparing to fill the spot. The accommodative policies and reductions will most probably follow Bernanke's original structure unless the economic data comes in better or worse than anticipated.
Today's GDP for Q3 2013 was a true testament to recovery as real GDP was 4.1 % while the previous reading was 3.6 %. The GDP Price Index was 2.0 % unchanged. Corporate Profits for Q3 2013 were 5.6 % while the previous reading was 5.8 %. The Atlanta Fed Business Inflation Expectations for December were at 1.9 % while the previous reading was unchanged. Kansas City Fed Manufacturing Index for December was -3 while the previous reading was 7. The Initial Jobless Claims for the week of December 14th was up 10,000 to 379,000 while the previous reading was 368,000. The Bloomberg Consumer Comfort Index for the week of December 15th was -29.4. The Philadelphia Fed Survey of General Business Conditions Index for December was 7.0 while the previous reading was 6.5. The Existing Home Sales for November was -4.3 % to 4.900 million while the previous reading was 5.12 million. The Leading Indicators for the week of December 19th was 0.8 % while the previous reading was 0.2 %. The Fed Balance Sheet for the week of December 18th was in total assets $14.1 billion while the previous reading was $61.3 billion. The Reserve Bank Credit was $53.0 billion while the previous reading was $21.1 billion. The Money Supply for the week of December 19th was $17.5 billion while the previous reading was $1.7 billion. The MBA Purchase Applications for the week of December 13th Composite Index was -5.5 % while the previous reading was 1.0 %. The Purchase Index was -6.0 % while the previous reading was 1.0 %. The Refinance Index was -4.0 % while the previous reading was 2.0 %. Housing Starts for November were 1.091 million while the previous reading was 0.873 million. The Housing Permits were 1.007 million while the previous reading was 0.974 million. The Consumer Price Index for November was at 0.0 % while the previous reading was -0.1 %. The CPI excluding food and energy was 0.2 % while the previous reading was 0.1 %. The Redbook Store Sales for the week of December 14th was 2.9 % while the previous reading was 2.6 %. The Housing Market Index for December was 58 while the previous reading was 54. The Current Account for Q3 2013 was - $94.8 billion while the previous reading was -98.9 billion. The Nonfarm Productivity for Q3 2013 was 3.0 % while the previous reading was 1.9 %. The Unit Labor Costs was -1.4 % while the previous reading was -0.6 %. The PMI Manufacturing Index Flash for December was 54.4 while the previous reading was 54.3. Treasury International Capital for October Foreign Demand for Long-Term US Securities was $35.4 billion while the previous reading was $25.5 billion. The US Nonfarm Payrolls for November was at 203,000 while the previous reading was 204,000. The Unemployment rate was 7.0 % while the last report was 7.3 %. The Average Hourly Earnings were 0.2 % while the previous reading was 0.1 %. The Average Workweek was 34.5 hours while the previous reading was 34.4 hours. Private Payrolls was 196,000 while the previous reading was 212,000. The Personal Income for October was -0.1 % while the previous reading was 0.5 %. The Consumer Spending was 0.3 % while the previous reading was 0.2 %.
Seasonally, this would be the time for the Gold market to rally, but now that the tapering is to begin with transparent plans by the Fed, Gold should header lower or simply trade in the current range of $1230.00 to $1187. The good thing is that the fear and anxiety with the uncertainty is out of the bag so everything could move on and take its natural course. While the bounces may be appealing, they may only be places to short. Approach with caution!
April Gold Chart 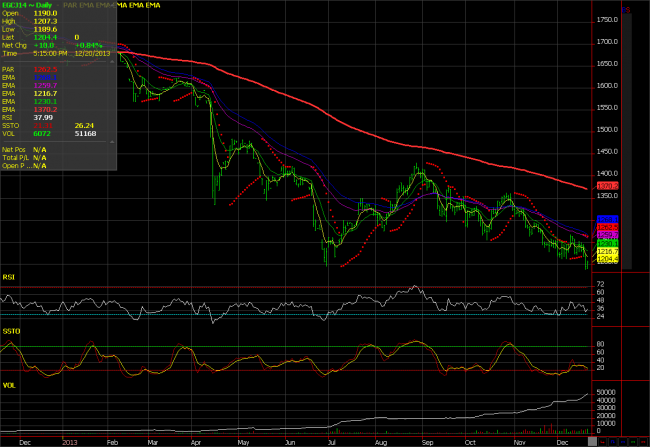 ake Take a close look and feel free to call in and talk to me in greater detail. It would be my pleasure. Good trading!
P.Sudeesh Kumar
p.sudeeshkumar@gmail.com
www.sudeeshbubby.blogspot.com
Linked in profile : n.linkedin.com/pub/sudeesh-kumar/27/3a9/307/
Follow me on twitter @Sudeeshbubby