The safe haven properties remain intact as the recent weak data and the political conflict in the Ukraine supported the Gold. The inflows of ETF Gold holdings are up 4.5 tons in February so far. Now the physical side of Gold may be weakened by the Chinese buyers standing aside as the price of Gold increases. With the slack data out of China showing a bit of a slowdown, they may be absent from the Gold market for a period of time. They are bargain hunters looking for lower price action. There is hope that the Indian tariffs on Gold imports will lift soon but for now 10 % duties remain. China became the biggest buyer of Gold in 2013 consuming about 1,066 tons according to the World Gold Council. Gold imports from Hong Kong by China were about 83.6 metric tons in January. The increase in the futures prices may have impeded the physical bullion sales this month. The US Mint reported that 24,500 ounces have been sold this month compared to 91,500 ounces in January. Gold dipped in 2013 increasing the demand to 3,756.1 tons or about $170 billion US. Of this, about 386.6 tons of Gold were purchased by the central banks. Last year only seven of the top forty central banks had replenished their reserves. The appetite for Gold has not waned and as a safe-haven product, the shift in allocations to the metal may be sooner than we think.
The GDP report today showed the US expansion at 2.4 % annual rate while the last one had been 3.2%, but the market sentiment responded well again viewing the harsh weather conditions across the US. The inclement weather conditions have blanketed the US with unusually cold weather patterns that kept consumers homebound. This affected car sales, retail sales, home sales and the labor conditions in general. The weakened data is regarded temporary to date, but when the conditions clear, the true state of the economy will be reflected. Consumer spending which makes up about 70 % of the GDP has been weak, yet US Fed Chairperson Janet Yellen attributes the recent weak data to the inclement weather conditions covering the US. US Fed Chairperson Janet Yellen states that it may take months to truly evaluate the data to determine the true strength/weakness of the US economy. Her comments may have been construed to prepare for a potential pause on the tapering progress. So far, we have reduced the $85 billion monthly Bond purchases to $65 billion. Her accommodative stance may have to evaluate the true nature of the employment data. These reports are primarily surveys and may not reflect the jobless individuals that simply may have given up and retired or the younger individuals that may have moved back home and go back to school. Yellen states that “The recovery in the labor market is far from complete”! What could possibly weaken this market more than anything could be slack data from China as the huge economy is often regarded as the leader in the global recovery. China has seen a contraction in manufacturing with about $4.8 trillion in shadow banking debt to address. Australia looks to the Chinese economy as the trade relations remain strong between the two countries. Actually, the trade relationships across the globe give the global economy a fragility much like a snowball effect. China is still viewed as a major power, but weakness can still impact the marketplace when assumed strength declines. The next policy meeting takes place March 18th and 19th. Yellen is known as one of the architects of the quantitative easing program that was instituted by the previous Chairman Ben Bernanke. The January Unemployment Report came in under expectations at 113,000 again attributing the harsh weather conditions for the shortfall! The December jobs report only produced 74,000 new jobs, so really the increase shows some recovery. Slow and steady may be the pace and this marketplace wants to see “WOW” numbers. If next month’s Employment Report shows any substantial decrease, then perhaps the Fed may reconsider the tapering plans. For now, it looks as though the Fed will remain on course with plans to taper the quantitative easing program by $10 billion each month for about the next consecutive months. The US is in expansion or a growth phase regardless of the size. While reducing the stimulus, the market sentiment will remain vulnerable to tapering too quickly with a soft economy. We have the US Employment numbers out the following Friday, so the Fed should keep busy with their evaluations.
Today’s Gross Domestic Product for Q4p:2013 Real GDP change was 2.4 % while the previous reading was 3.3 %. The GDP Price Index was 1.6 % while the previous reading was 1.3 %. The Chicago PMI for February was 59.8 while the previous reading was 59.6. US Pending Home Sales for January was 95.0 up 0.1 % while the previous reading was down -8.7 % to 92.4. The Consumer Sentiment for February was 81.6 while the previous reading was 81.2. The US Jobless Claims for the week of February 22nd were up 14,000 to 348,000 while the previous reading was 336,000. The Continuing Claims were up 8,000 to 2.964 million. The Durable Goods New Orders for January were -1.0 % while the previous reading was -4.3 %. The Durable Goods Orders excluding transportation were 1.1 % while the previous reading was -1.6 %. The Kansas City Fed Manufacturing Index for February was 4 while the previous reading was 5. Bloomberg Consumer Comfort Index for February was -28.6 while the previous reading was -30.6. The New Home Sales for January level was 468,000 while the previous reading was 414,000. The New Home Sales seem to gain traction while the existing home sales remain slack. Definitely a bright outlook for home builders. The MBA Purchase Applications for the week of February 21st Composite was -8.5 % while the previous reading was -4.1 %. The Purchase Index was -4.0 % while the previous reading was -6.0 %. The Refinance Index was -11.0 % while the previous reading was -3.0 %. The Richmond Fed Manufacturing Index Level change for February was -6 while the previous reading was 12. The ICSC-Goldman Store Sales for the week of February 22nd was -0.6 % while the previous reading was 2.5 %. The Redbook Store Sales for the week of February 22nd was 2.9 % while the previous reading was 3.2 %. The FHFA House Price Index for December was 0.8 % while the previous reading was 0.1 %. The S&P Case-Shiller HPI for November 20-city SA was 0.8 % while the previous reading was 0.9 %. The 20-city NSA was -0.1 % while the previous reading was -0.1 % unchanged. The Consumer Confidence for February was 78.1 while the previous reading was 80.7. The State Street Investor Confidence Index for February was 123.0 while the previous reading was 114.4. The PMI Services Flash for February was 52.7 while the previous reading was 56.6. The Chicago Fed National Activity Index for January was -0.39 while the previous reading was 0.16. The Dallas Fed Manufacturing Survey Business Activity Index for February was 0.3 while the previous reading was 3.8. The Production Index was 10.8 while the previous reading was 7.1. The last US Unemployment came in a meager 113,000 new jobs created for the month of January while the previous reading was 74,000. Traders again managed to blame the light numbers on freezing weather conditions sweeping across the US. The Unemployment Rate came in at 6.6 % while the previous reading was 6.7 %. The Manufacturing Payrolls were 21,000 while the previous reading was 9,000. The Private Sector Payrolls were 142,000 while the previous reading was 87,000. The Government Payrolls was -29,000 while the previous reading was -13,000. The Federal Government Payrolls was -12,000 while the previous reading was -2,000. The Service Sector Payrolls was 66,000 while the previous reading was 77,000. Temporary help agencies increased by 8,100. The Average Hourly Earnings was $24.21 + 6 cents. The Average Work Week Hours was 34.4 unchanged. Next Friday, we look forward to the next Employment Report.
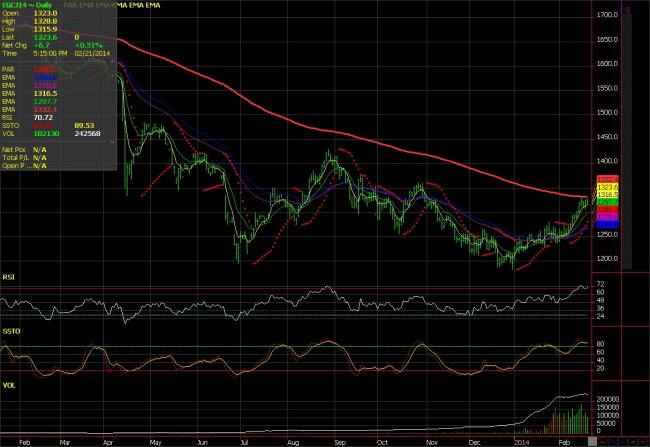
The Gold (April) contract must remain above $1316.20 to maintain the uptrend. Next week looks to be a potential retracement time for the Gold market. We could potentially retrace to $1250.00. It seems as though traders have gotten into the pattern of shorting the Gold on the rallies which may keep it capped for the short-term. Longer-term projections are extremely positive. The recovery is fragile and the Fed may have used their last bullet. Should they run out of poor weather excuses they may go back to the stimulus, cease the tapering or simply watch the slackened data which is all positive for Gold.
Gold Chart

P.Sudeesh Kumar
p.sudeeshkumar@gmail.com
http://sudeeshbubbby7.blogspot.in
Linked in profile : n.linkedin.com/pub/sudeesh-kumar/27/3a9/307/
Follow me on twitter @Sudeeshbubby