The National Association of Realtors reported that home sales slackened by 5.1 % to an annual rate of 4.62 million units in January! The soft numbers again were rationalized as again due to the freezing weather conditions covering the US last month. The NAR had also reported the average price of used homes up 10.7 % to $188,900 in January. This could be due to reduced inventories on the market. Credit is still tight and mortgage rates have increased again discouraging the buyer from pursuing home search. The inventory was up a bit from the previous month 2.2 %. When spring does pop, housing is expected to really make a come-back. It is just too early to tell just how promising it may be from this vantage point. This is so far regarded temporary and expectations for expansion still override the sentiment. The Fed minutes were read this week and traders still were looking for signs of Fed action on the rather weak data that has the global marketplace wondering. The tapering seems to be on course as stated regardless of the soft data. The International Monetary Fund states that the global recovery is weak “and significant downside risks remain”. The G-20 meets February 22nd and 23rd in Sydney, Australia. It is anticipated that the Fed may have to defend the stimulus interjections and then again the “tapering” perhaps as well. The IMF has concerns regarding deflation with both stimulus and tapering creating erratic market conditions. The IMF also regards volatility as a possible threat to the economic recovery. The trick question is how much of the weak data was really caused by the freezing temperatures? Once the weather conditions can no longer be held accountable for the poor numbers, we will again look to the Fed for their “accommodative policy”. The modest expectations allow any meager positive earnings to be viewed optimistically. The US has been told the same thing continuously by the Federal Reserve about the double mandate of Labor and Inflation and Fed Chairman Janet Yellen re-iterated those same words and the market responded positively to the stable consistent outlook. She spoke in her first semi-annual monetary policy testimony before the House Financial Services Committee in Washington this week. She wishes to continue the current monetary policy to taper in measured steps but with no pre-set course but rather contingent on labor and inflation. She has found unemployment to be elevated but considers the harsh weather conditions that have blanketed the US as a negative factor. She must really look at next month’s unemployment report to really be able to determine if it is a true case or impacted by temporary conditions. The Fed will remain accommodative and the market should continue to rally on the stability. It seems that the marketplace will anticipate a pause in the tapering if the numbers remain soft past the harsh weather conditions. The next policy meeting takes place March 18th and 19th. She is known as one of the architects of the quantitative easing program that was instituted by the previous Chairman Ben Bernanke. The January Unemployment Report came in under expectations at 113,000 again attributing the harsh weather conditions for the shortfall! The December jobs report only produced 74,000 new jobs, so really the increase shows some recovery. Slow and steady may be the pace and this marketplace wants to see “WOW” numbers. If next month’s Unemployment Report shows any substantial decrease, then perhaps the Fed will reconsider the tapering plans. For now, it looks as though the Fed will remain on course with plans to taper the quantitative easing program by $10 billion each month for about the next consecutive six months. The US is in expansion or a growth phase regardless of the size. The Senate had not been able to come up with the vote for a bill to renew expired benefits for the long-term unemployed which may be a setback for the economy as a whole. It is thought that over 1.3 million US citizens lost their benefits and more may add to the figure as time passes. It is thought that many baby boomers have simply backed away from the jobs scene to retire. The Trade Gap had expanded 12 % to about $38.7 billion perhaps attributed to decreased exports. Lawmakers vote to suspend raising the debt ceiling until March 2015 for the $16.7 trillion cap on borrowing. It is thought that a US default could lead to a severe economic downturn. House of Representatives Speaker John Boehner has suggested that while raising the debt limit that the jobs and economy should also be dealt with. The budget deficit according to the Congressional Budget Office is projected at about $514 billion. Projections continue that the debt should continue to fall further in the future years. The forecast for the US economy may still be bumpy for the next few years. There is also debate whether to raise the minimum wage which would take about 900,000 people above the poverty level, but would annihilate about 500,000 jobs by 2016. While reducing the stimulus, the market sentiment will remain vulnerable to tapering too quickly with a soft economy.
The Existing Home Sales for January were 4.62 million down 5.1 % while the previous reading was 4.870 million. US Jobless Claims for the week of February 15th were down 3,000 to 336,000 while the previous reading was 339,000. The Continued Claims were up 37,000 to 2.981 million with a one-week lag time. The Consumer Price Index for January was 0.1 % while the previous reading was 0.3 %. The CPI excluding food and energy was 0.1 % while the previous reading was unchanged. The PMI Manufacturing Index Flash for February was 56.7 while the previous reading was 53.7. The Philadelphia Fed Survey for February was -6.3 while the previous reading was 9.4. The Bloomberg Consumer Comfort Index for February was -30.6 while the previous reading was -30.7. The Leading Indicators for January were 0.3 % while the previous reading was 0.1 %. The Fed Balance Sheet for the week of February 19th was $29.8 billion Total Assets while the previous reading was $10.2 billion. The Reserve Bank Credit was $35.5 billion while the previous reading was $10.5 billion. The Money Supply for the week of February 10th was $41.3 billion while the previous reading was $14.9 billion. US Housing Starts for January were at 0.880 million while the previous reading was 0.999 million. The Housing Permits for January were 0.937 million while the previous reading was 0.986 million. The MBA Purchase Applications Composite for the week of February 14th was -4.1 % while the previous reading was -2.0 %. The Purchase Index was -6.0 % while the previous reading was -5.0 %. The Refinance Index was -3.0 % while the previous reading was -0.2 %. The ICSC-Goldman Store Sales for the week of February 15th were 2.5 % while the previous reading was -0.3 %. The Redbook Store Sales for the week of February 15th was 3.2 % while the previous reading was 2.8 %. The FOMC minutes came out citing the debate on tapering but still quite vague regarding employment. The Empire State Manufacturing Survey General Business Conditions Level for February was 4.48 while the previous reading was 12.51. The Treasury International Capital Foreign Demand for Long-Term US Securities for December was -$45.9 billion while the previous reading was -$29.3 billion. The Housing Market Index for February was 46 while the previous reading was 56. The E-Commerce Retail Sales for Q4:2013 was 3.4 % while the previous reading was 3.6 %. Industrial Production for December was -0.3 % while the previous reading was 0.3 %. The Capacity Utilization Rate was 78.5 % while the previous reading was 79.2 %. The Manufacturing was -0.8 % while the previous reading was 0.4 %. Export Prices for January were 0.2 % while the previous reading was 0.4 %. The Import Prices were 0.1 % while the previous reading was 0.0 %. Consumer Sentiment Index for February was 81.2 while the previous reading was unchanged. The US Unemployment came in a meager 113,000 new jobs created for the month of January while the previous reading was 74,000. Traders again managed to blame the light numbers on freezing weather conditions sweeping across the US. The Unemployment Rate came in at 6.6 % while the previous reading was 6.7 %. The Manufacturing Payrolls were 21,000 while the previous reading was 9,000. The Private Sector Payrolls were 142,000 while the previous reading was 87,000. The Government Payrolls was -29,000 while the previous reading was -13,000. The Federal Government Payrolls was -12,000 while the previous reading was -2,000. The Service Sector Payrolls was 66,000 while the previous reading was 77,000. Temporary help agencies increased by 8,100. The Average Hourly Earnings was $24.21 + 6 cents. The Average Work Week Hours was 34.4 unchanged.
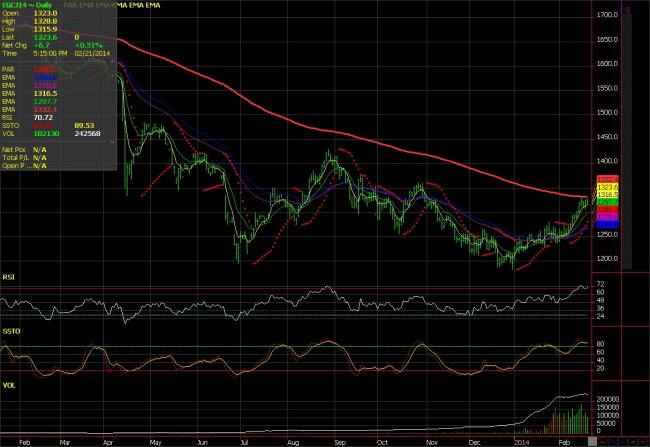
We trended higher this week as soft data just spurred the allocations toward the Gold! If the April Gold contract can stay above $1280.30, we have support. $1360.50 may be a near-term target. This could be another ploy to excite traders about the bullish sentiment, but traders may began to sell at $1360.50 and/or $1390.50. We may remain cautiously bullish for the moment. One must be cautious as traders have found that they love to sell a bounce. Any possible moves to the upside may be temporary.
Gold Chart
Take a close look and feel free to call in and talk to me in greater detail. It would be my pleasure. Good trading!
P.Sudeesh Kumar
p.sudeeshkumar@gmail.com
http://sudeeshbubbby7.blogspot.in
Linked in profile : n.linkedin.com/pub/sudeesh-kumar/27/3a9/307/
Follow me on twitter @Sudeeshbubby
No comments:
Post a Comment