Friday, March 28, 2014

Weekly Gold

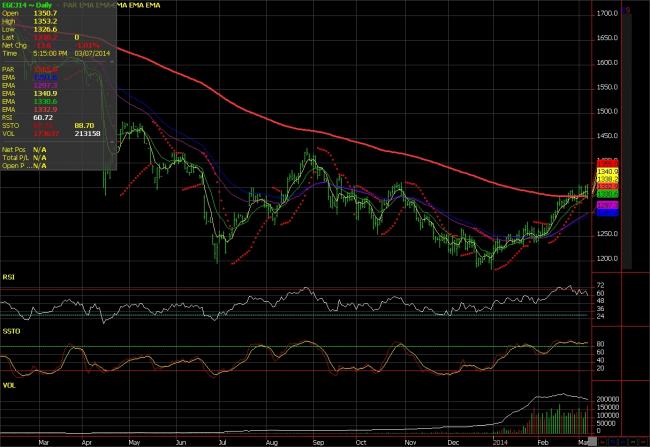
June Gold settles 1294.8, down $39.90 for the week ended Friday March 28th

Gold futures remained below $1,300 an ounce on Friday, unable to trim this week's significant losses despite a slightly weaker U.S. dollar. June gold fell 50 cents to settle at $1,294.30 an ounce on the Comex division of the New York Mercantile Exchange. The front-month contract was down more than 3 percent this week. The precious metal lost its luster last week when Federal Reserve Chair Janet Yellen suggested that hikes may be in the cards about a year from now. Today's encouraging U.S. consumer spending data may give the Fed's more hawkish members further reason to advocate for tightening monetary policy sooner than expected. New government figures showed consumer spending rose 0.3 percent in February, suggesting that the mid-winter slowdown was weather-related and temporary.

Looking ahead to economic news next week, analysts said they'll keep an eye out for the European Central Bank meeting on Thursday and Friday's March nonfarm payrolls report from the U.S. Labor Department. Currency analysts said there's been some discussion in the markets that the ECB will act in some dovish way, given that ECB President Mario Draghi has expressed concern that the recent strength in the euro is becoming a risk to growth and the inflation targets. Worries about deflation cropping up in the European Union increased after weak consumer price index readings in Spain, although German CPI data came in about as expected. Spanish retail sales were soft and France reported a fall in consumer spending. Friday the U.S. Labor Department is slated to release its March nonfarm payrolls report, which will keep gold-market traders on alert. Pre report trade estimates are looking for a gain of 195,000 jobs with the unemployment rate falling to 6.6 percent. Technicals for next week come in as follows for June Gold and May Silver. For June Gold, support sits at 1275.4 and below here at 1256.0. Support sits up at 1324.9 and above there at 1355.0. For May Silver support is down first at 19.47, and below there at 19.15. Resistance is up at 20.21 and above there at 21.05.


--

Tuesday, March 25, 2014

SIP vs Lumpsum... Which One Works Better in Mutual Fund Investment?

SIP is one of the most advocated way of investing in mutual funds. Without doubt SIP is a good tool for systematically accumulating a corpus by investing with market-linked investments for future goals. In this article we look at why or under what circumstances is SIP is a better way to invest. We will be illustrating our thoughts with numbers.

Firstly what is SIP?

SIP stands for Systematic Investment Plan, a mode of investing in mutual funds that allows one to invest fixed amounts in a specific mutual fund scheme for regular periods. It makes regular investment convenient with the auto debit facility, and affordable with a low minimum investment requirement. SIP doesn’t incur any additional charges.

However if we were to compare both lump sum and SIP mode of investments, one should understand that the performance of the particular investment will depend on the market conditions at that time and if it is invested for long term or short term in case of lump sum and cost averaging in case of SIP. Cost averaging results in an investment being purchased at an average cost spread over a period of time instead of one cost on a single day, which could be higher than or lower than the average.

Here is a demonstration of how these two factors could affect your investments –

Disclaimer: Above chart is for illustrative purpose only.
SIP does not assure a profit or guarantee protection against loss in a declining market and should not be construed as a promise, guarantee on or a forecast of any minimum returns.

Thus investing in SIP generally one would get fewer units when price is high and more units when price is low.
However the table above also makes it obvious that the game would favour lump sum investment had it been made when the unit price was lowest (generally when the equity market is down). In such a case the investments would look like this, all else remaining the same.

Disclaimer: Above chart is for illustrative purpose only.
SIP does not assure a profit or guarantee protection against loss in a declining market and should not be construed as a promise, guarantee on or a forecast of any minimum returns.

Lump sum has the potential to outshine SIP. However one should remember that SIP offers an averaged out return thus generally insulates against worst returns.

Disclaimer: Above chart is for illustrative purpose only.
SIP does not assure a profit or guarantee protection against loss in a declining market and should not be construed as a promise, guarantee on or a forecast of any minimum returns.

As the numbers above show, SIP works better than lump sum investment in volatile periods. Since no one can predict market movements accurately it is extremely risky to make bets on what time to buy units or sell them.

One brownie point for SIP

From a practical point of view SIP is the preferred route of mutual fund investments as investing through SIP’s inculcates the discipline of saving & investing. It is best to align the frequency of investments with that of earning income. If you are salaried employee, you could go formonthly SIP to regularize your savings. Most of our bills have a monthly cycle so viewing SIP as a monthly ‘expense’ helps in the investing habit formation.

So what should it be? Lump sum or SIP?

In our view, as stated above, SIP helps you inculcate the habit of investing, and as salaries come in monthly so should investments be. However do not rule lump sum investing out, in case you get your annual bonus or an inheritance it is best to invest that money wisely in a suitable mutual fund. Thus to conclude, for investing in mutual funds we believe one could opt for SIP mode, unless you have a lump sum amount to invest for long term (more than 5 – 7 yrs). However we strongly suggest you to consult with your financial advisor before proceeding with any investment decision.


--

Saturday, March 22, 2014

weekly gold

The potential conflict in the Ukraine has stabilized as Russian President Putin has not advanced further on the Ukraine territories.  The debut by Fed Chairperson Janet Yellen had put tightening on the calendar which is also negative for Gold.  The European Union (EU) is considering modifying the 400 ton a year selling boundry on the Gold which may unleash more massive selling.  China may experience a increase in economic expansion.  The fundamentals in Gold point to negative action in the Gold market, yet one cannot ignore the technicals.  The April Gold chart has an extremely Gold formation suggesting we could see an advance on the Gold next week.  This is in contrast to most analysts right now.   The range may still hold between $1320.00 to $1393.00.  The net longs according to the CFTC COT report was 123,007 contracts as of March 11th.  According to the World Gold Council, in 2013 the Gold demand increased 21 % to 3,756 tons. Global demand for jewelry was up 17 % to 2,209 tons.  Demand in the technology sector was 405 tons.  The outflows from ETF's was 881 tons.  Chinese and Indian Gold bar purchases was up 38 %.  The need for Gold in India has outstrip its import duties. Smuggling has increased due to the approximate 11 % import tax.  India began imposing the import taxes in an attempt to control the deficit along with increased inflation and their devalued rupee.  The physical metal is still sought after due to the safe-haven aspects and as a hedge against inflation.  

 This week Yellen’s potential tightening in as little as six months may have been misspoken but cannot be taken back.  After all, this was a stimulus fed market and we have heard many times that tapering is not tightening.   Of course, the market can shrug this off.  The sentiment of this market seems to be no news is good news, but unexpected news can be startling.  Factory orders and car sales may increase, but the energy prices may help to determine how much the cost of production may be.  President Obama had released some of the Crude Oil reserves to begin the sanctions on Russia as they produce the energy products.   OPEC came back with a reduction in their production.  Then Iraq advanced their production, so that may be key in determining the success of the recovery.  The US may also boost their shale production to offset any energy coming from Russia.  The market had been supported by strong housing data and Russian President Putin calming the fears of the investors by clarifying his intent for the Ukraine.   The Housing Permits for February were 1.018 million while the previous reading was 0.937 million an increase of 7.7 %.  This is the bright spot for increased employment in the housing sector.  Vladimir Putin announced that he is not intent on splitting up the Ukraine.  The vote of Sunday was in favor of Crimea to secede and ask the Russian Federation for Membership.  Crimea had belonged to Russia back in the 1954 until Nikita Khrushchev had given the Black Sea region to the Ukraine.  Russian President Putin defends his right to send troops to the Ukraine on behalf of the Russian citizens residing there.  He actually stayed within the treaty limit of 25,000 troops.   Global leaders still regard Russia’s action as grabbing a country for benefits perhaps derived from the resources of the region.   World leaders are intent on watching Putin to be sure his “annexing’ stops at Crimea!   British Prime Minister David Cameron regarded this action as a breach of international law.  Sanctions may be imposed on Russia still yet regarding this action.  US sanctions have already stopped the Visa and MasterCard services at the Bank Rossiya in St. Petersburg.   Sanctions on parties in Putin’s inner circle have been targeted.  The sanctions have already had an impact on Russia as Fitch’s credit rating agency has cut the outlook to BBB negative along with Standard & Poors.  Loans have been called in and gold reserves have fallen to $493.2 billion as of March 14th.   The G-8 said that they will suspend the G-8 Summit in Sochi this year.    The Organization for Economic Cooperation and Development has spoken of revoking Russia’s entrance into the organization.  Asset blockades, financial and trade sanctions have all been suggested.  Putin may pay about $3 billion ++ costs to annex Crimea.  The problem seems to be a history of violating international boundaries for the Russian President.  Putin retorts that the US and NATO have come close to the Russian borders.  For the moment, the market is taking Putin’s words as peaceful!  If or when sanctions are imposed by other countries, will the environment remain peaceful or could another cold war escalate?  For now, Putin seems to be concentrating on the completion the annexing of Crimea.   Russia and the US had fought on the same side during WWI and WWII yet tensions still run very deep.    Russian troops seized the Crimean port of Sevastopol raising their flag.   Russia’s take-over of Crimea will perhaps consist of pension adjustments up to the Russian pensions, raises, infrastructure upgrades such as quite possibly a bridge and a tunnel.

The Atlanta Fed Business Inflation Expectations for March was 1.8 % while the previous reading was 2.0 %.  The Initial Jobless Claims for the week of March 15th were up 5,000 to 320,000 while the previous reading had been 315,000.  The continuing claims were up 41,000 to 2.889 million.   The Bloomberg Consumer Comfort Index for March were -29.0 while the previous reading had been -27.6.  The Philadelphia Fed Survey General Business Conditions for March was 9.0 while the previous reading was -6.3.  The Existing Home Sales was -0.4 % to  4.600 million while the previous reading had been 4.62 million.  The Leading Indicators for February were 0.5 % while the previous reading was 0.3 %.  The Fed Balance Sheet of Total Assets for the week of March 19th was $40.7 billion while the previous reading was $9.6 billion.  The Reserve Bank Credit was $39.1 billion while the previous reading had been $11.2 billion.  The Money Supply for the week of March 10th was $23.7 billion while the previous reading was -$13.9 billion.  The MBA Purchase Applications Composite Index for the week of March 15th was -1.2 % while the previous reading was -2.1 %.  The Purchase Index was -1.0 % unchanged from  the previous reading.  The Refinance Index was -1.0 % while the previous reading was -3.0 %.  The Current Account was -$81.1 billion while the previous reading was -$94.8 billion.  The Federal Open Market Committee Announcement kept the Fed Funds Rate at 0 to 0.25 % unchanged.   The Feds plans to taper remains intact where April will have another $10 billion reduction on the monthly bond purchases known as quantitative easing.   The Fed also gave the country a tightening condition where perhaps 2015 could allow for an interest rate hike.  he ICSC-Goldman Store Sales for the week of March 15th was 0.7 % while the previous reading was 1.3 %.  The Redbook Sales was at 2.8 % while the previous reading was 2.5 %.  Housing Starts for February were 0.907 million while the previous reading was 0.880 million.  The Housing Permits for February were 1.018 million while the previous reading was 0.937 million.  The Consumer Price Index for February was 0.1 % unchanged.  The CPI excluding food and energy was 0.1  % unchanged.  Treasury International Capital Foreign Demand for Long-Term US Securities for January was $7.3 billion while the previous reading was -$45.9 billion.  The Empire State Manufacturing Survey of General Business Conditions Index for March was at 5.61 while the previous reading had been 4.48.  Industrial Production for February was 0.6 % while the previous reading was -0.3 %.  The Capacity Utilization Rate was 78.8 % while the previous reading was 78.5 %.  The Manufacturing portion was 0.8 % while the previous reading was -0.8 %.  The Housing Market Index for March was 47 while the previous reading was 46.  The last Nonfarm Payrolls for February was a whopping 175,000 while the previous reading was 113,000.  The Unemployment Rate was increased to 6.7 % while the previous reading was 6.6 %.  The Average Hourly Earnings were 0.4 % while the previous reading was 0.2 %.  The Average Workweek was 34.2 hours while the previous reading was 34.4 hours.  The Private Payrolls was 162,000 while the previous reading was 142,000.  Next week, we have data on the Gross Domestic Product, durable goods and housing due out! 

The Gold (April) contract is in sell mode if it stays below $1388.50.  It could retrace to $1320.00 or back up to $1388.50 depending on the Ukraine situation and the economy.   Anything can happen.  The options may give a trader the right to control a futures position at a specific price or to simply profit/loss on the premium itself.  It is suggested to consult your broker without delving into options if you are unfamiliar with them. 

  Gold Chart 


--

Saturday, March 15, 2014

foecast of currency & gold


US Dollar Looks to Fear, FOMC to Set Off Lasting Bull Trend

What will move the US dollar in the week ahead? We are awash in major fundamental catalysts – the type that can generate meaningful trends and not just short-lived bouts of volatility.

ECB's Draghi Warns on Euro Strength - Will it Keep Rising?

The European Central Bank is losing credibility as it flip-flops a week after its rate decision: will or will not the Euro's elevated exchange rate prompt action? Not yet, not when the EURUSD is only trading near $1.4000.

Japanese Yen Surge May Offer Attractive Selling Opportunity

The Japanese Yen rallied sharply versus the US Dollar and other major counterparts as the highly-correlated Nikkei 225 posted its worst weekly performance in 9 months.

Gold on 6 Week Streak- $1400 within Striking Distance Ahead of FOMC

Gold rallied for a sixth consecutive week with the precious metal advancing 2.8% to trade at $1378 ahead of the New York close on Friday.

Australian Dollar Eyeing FOMC Outcome, Geopolitical Risks

The Australian Dollar is likely to be preoccupied with macro-level forces in the week ahead as the FOMCpolicy meeting and geopolitical factors take the spotlight.

Forex_Weekly_Trading_Forecasts_Volatility_to_Prevail_Amid_FOMC_Decision_Geopolitical_Tension_body_Picture_5.png, Forex Weekly Trading Forecasts: Volatility to Prevail Amid FOMC Decision, Geopolitical Tension


--

Weekly Gold


The potential conflict in the Ukraine and the slowdown in China may be the perfect storm for Gold!  The possible deflation fears in the Euro Zone may add to the fear factor.  Holdings in the large Gold SPDR Trust increased yesterday to 813.3 metric tons yesterday.   .  For the week ending March 4th, the net-long Gold futures and options expanded to 118,241 positions.  The US Mint sold about 4,000 ounces of the Gold Eagle Coins last week.  The demand for Gold in China to date is believed to be around  418 tons.  Anticipated demand going into 2015 is about 550 metric tons.  The safe-haven aspects of the Gold may just appeal more than many paper assets with the fear factor out there.  China typically likes to buy the Gold at lower levels, but certainly should the fear factor increase, the allocations should find the Gold more appealing.   

Sunday is vote in the Ukraine on the referendum where it will be decided if Crimea region would be annexed to Russia.   Russia had actually given Crimea to the Ukraine in 1954.   Russia actually has been going thru military exercises near the border of the Ukraine showing its stance to have the right to protect its citizens residing in the Black Sea region.  The conflict has heated up in the eastern Ukraine area where one person was killed yesterday.  G-7 leaders may act on any referendum to annex Crimean Peninsula.  While showing the opposition to Russia, the world leaders still hope Russia to remain cooperative in the Iran talks regarding nuclear policies.  The market is nervous about any potential “cold war” with Russia concerning the Ukraine.   Uncertainty is what pauses this market.  The uncertainty comes from two sources: The potential Russian conflict over Crimea and the data possibly coming out of China.  These two areas are strong enough fear factors to move the market even with the US in a solid recovery.   Russian President Vladimir Putin had petitioned his troops that were on the Ukraine border confirming that his intensions were not to invade Crimea!  He sent 19,000 military to the Crimea region.   The small Black Sea region of Crimea is quite valuable in terms of resources.    The Ukraine has been in political turmoil leaving itself open and vulnerable to other countries.  The Ukraine Interior Minister Arsen Avakov discussed how the country may be prepared to send 20,000 of its militia to the borders for protection.  The US had offered loans to the Ukraine totaling about $1 billion via financial institutions to aid with the struggling economy.  Viktor Yanukovych had been an ally to Putin and after becoming cast out from the Ukraine as President may have solicited aid from Putin.  The US had put together sanctions to penalize Russia for any overtures and the Ukraine is struggling to hold Crimea.  Crimea is vital as an access route thru the Black Sea Ports.  Now Crimea parliament votes whether to join Russia.  US President Barack Obama has warned Russia along with the G-7 about potential sanctions that may be imposed.  To further the point, the President has released holdings of reserve crude stock oil supplies from the US Strategic Petroleum Reserve.  This brought down the price of Crude Oil  which could potentially hurt Russia as a producer.  OPEC then came back with a vow to reduce production by 1.1 million barrels a day.    Russian President Vladimir Putin has defended his rights to infiltrate Ukraine borders to protect Russian citizens.  The European Union has condemned any action in Crimea as illegal.  The March 16th referendum may be considered to violate international law.  The uncertainty resulting in the Russian Presidents intentions for Crimea weigh on the market and any potential conflict with Russia would change history forever.  The G-8 said that they will suspend the G-8 Summit in Sochi this year.    The Organization for Economic Cooperation and Development has spoken of revoking Russia’s entrance into the organization.  Asset blockades, financial and trade sanctions have all been suggested.  Russian President Putin defends his right to send troops to the Ukraine on behalf of the Russian citizens residing there.  China’s industrial output was at an 8.6 % rate, retail sales data came in weaker today at 11.8 %.  Their initial growth target as of last week was 7.5 %, but today that had to come down to 7.3 %.  Copper typically is seen as a leading indicator for China’s growth which consumes about 45 % of the global demand.  The Copper has been in a severe downtrend.  As a world leader, China is front and center when it comes to global recovery and how it is perceived.  China’s exports have dropped 18.1 % in February.  The Shanghai Composite Index has decreased by 2.9 %.  China had also succumbed to a bond default as Shanghai Chaori Solar Energy Science and Technology Co. had missed an interest payment.  The US wants to uphold its voting rights with the International Monetary Fund (IMF) where they may hold more weight with global issues.  The voting rights give more power to control thru the vote, but the US owes still from a 2010 commitment which US President Obama wishes to settle.  The European Central Bank kept their interest rates unchanged at 0.25 % possibly due to stronger inflation and increased productivity!  The European Union has promised  $1.6 billion euros to the Ukraine in emergency aid.  The euro has strengthened on ECB President Draghi’s optimism regarding the Euro Zone activity.  He regards the deflation risks as easing for the moment.  Their recovery is regarded as moderate.    The next US policy meeting takes place March 18th and 19th.  Yellen is known as one of the architects of the quantitative easing program that was instituted by the previous Chairman Ben Bernanke.   If the Ukraine situation should heat up and/or the Chinese data show weakness, we may look for some profit-taking next week.   In February, 175,000 new jobs were created giving a boost to the marketplace as analysts were expecting 150,000.  The recovery looks to be on track even with the inclement weather conditions sustained over the last few months.  The data had been mixed leaving traders to ponder whether this was true weakness or a temporary weather driven theme.  A potential retracement target long-term may be $1794.50.   If $1825.50 is not penetrated, the market may return back at the highs.  The two factors weighing on the market are the sluggish Chinese data and the potential conflict in the Ukraine. 

Today’s PPI-FD was -0.1 % while the previous reading was 0.2%.  The PPI-FD excluding food and energy was -0.2 % while the previous reading was 0.2 %.  PPI-FD excluding food, energy and trade services was unchanged.  PPI-FD Goods was unchanged at 0.4 %.   PPI-FD Services was -0.3 % while the previous reading was 0.1 %.  Consumer Sentiment for March was 79.9 while the previous reading was 81.6.  The Initial Jobless Claims for the week of March 8th was down 9,000 to 315,000.  Continuing Claims were down 48,000 to 2.855 million.    Retail Sales for February were 0.3 % while the previous reading was -0.4 %.  The Retail Sales excluding automobiles was 0.3 % while the previous reading was 0.0 %.  The Retail Sales excluding gasoline and automobiles was 0.3 % while the previous reading was -0.2 %.  The Export Prices for February were 0.6 % while the previous reading was 0.2 %.   The Import Prices were 0.9 % while the previous reading was 0.1 %.  Business Inventories for January were 0.4 % while the previous reading was 0.5 %.  The Bloomberg Consumer Comfort Index for March was -27.6 while the previous reading was -28.5.   The MBA Purchase Applications Composite Index for the week of March 7th was -2.1 % while the previous reading was 9.4 %.  The Purchase Index was -1.0 % while the previous reading was 9.0 %.  The Refinance Index was -3.0 % while the previous reading was 10.0 %.  The Wholesale Trade Inventories for January were 0.6 % while the previous reading was 0.3 %.  The ICSC-Goldman Store Sales for the week of March 8th were 1.3 % while the previous reading was 0.3 %.  The Redbook Store Sales were at 2.5 % while the previous reading was 2.9 %.  The JOLTS (Job Openings and Labor Turnover Survey) for January was 3.974 million while the previous reading was 3.990 million.  The NFIB Small Business Optimism Index for February was 91.4 while the previous reading was 94.1.  The TD Ameritrade IMX for February was 5.74 while the previous reading was 5.66.  The Nonfarm Payrolls for February was a whopping 175,000 while the previous reading was 113,000.  The Unemployment Rate was increased to 6.7 % while the previous reading was 6.6 %.  The Average Hourly Earnings were 0.4 % while the previous reading was 0.2 %.  The Average Workweek was 34.2 hours while the previous reading was 34.4 hours.  The Private Payrolls was 162,000 while the previous reading was 142,000. 

The Gold (April) contract is in buy mode if it stays above  $1329.40.  It could retrace to $1290.00 or back up to $1550.00 depending on the Ukraine situation and the Chinese economy.   Anything can happen.  The options may give a trader the right to control a futures position at a specific price or to simply profit/loss on the premium itself.  It is suggested to consult your broker without delving into options if you are unfamiliar with them. 

  Gold Chart 


--

Monday, March 10, 2014

Five reasons why rupee may not appreciate much Read more at: http://economictimes.indiatimes.com/articleshow/31781213.cms?utm_source=contentofinterest&utm_medium=text&utm_campaign=cppst

NEW DELHI: The Indian rupee, which has over the past few days has strengthened substantially on the back of record foreign investment in equities and a drastic dip in the current account deficit, may not appreciate much more. 

The rupee has been largely resilient, following its drastic depreciation last year. A slew of measures by the Reserve bank of India and steps to contain current account deficit by the government have helped check the slide. 

However global and domestic may act as deterrents in the currency's bid to appreciate substantially from current levels. We take a look at five factors that may play the part pooper in rupee's rally: 

Growth concerns: India's economic growth has been dwindling below the 5% mark and many economists are of the opinion that the economy will undergo a painful phase of slow economic recovery. This may weigh on the rupee's chances of rallying. 

Sugandha Sachdeva, AVP & Incharge- Metals Energy & Currency Research, Religare Securities has said, "In spite of a flurry of positive factors in the current environment, there are still growth concerns. Further uptick in domestic currency seems implausible unless the level of 61 (spot)is convincingly breached ,as it has been acting as a stiff hurdle restricting further appreciation of rupee since last 5 months." 

Commenting on the level where the rupee is headed, Sachdeva is of the view that rupee is expected to march toward 61 mark in spot market and may stabilize around the same in near term. 

Demand for dollar: Higher demand for dollars from importers and rise in the greenback after strong non-farm payrolls data in the US last week will also put a halt to rupee's appreciation in the near-term, say bankers and experts. 

"The rupee is at the 61 level, and at this level we will see lot of buying coming in from importers," said KN Reghunathan, treasurer at the state-run Union Bank o .. 


--

Sunday, March 9, 2014

What should you do when Markets hit a record high?

The S&P BSE Sensex surged to an all-time intraday high of 21,960.89 and then went on to make a historical closing high of 21,919 up 405.92 points on 7th March, 2014.

The ups and downs of the financial markets are always in the news. The market can plunge or rise like a phoenix at any time. Volatility seems to have become the norm for the markets now. It is therefore natural for investors to worry about their investments in these uncertain markets. The reality is that market swings happen often and when they do, it can be disturbing for many investors like us.

Now that the markets are at record high, an expected reaction to this might be to redeeming all your holdings in equities. But disciplined investors just do the opposite. They don’t panic or get overwhelmed when the market swings and keep holding onto their investments. They avoid taking any short term measures which could damage their portfolio in the long run.

Market movements cannot be predicted, but here are some tips may help you to make sensible investment decisions:

Set your investment strategy

Surviving in market volatility is lot easier when you have a firm investment strategy. To create a sound investment strategy, you should understand several crucial factors, which are:

• Your investment goals: You should set your financial goals for which you want to invest
• Your time horizon for investments: The time period for which you want to invest depending on your investments goals.
• Your tolerance for risk: You should also gauge your risk appetite i.e. the amount of risk you are ready to take.

Have a financial plan

Having a financial plan helps you deal with a volatile market in a much better way. A financial plan includes the following steps:

• Set and prioritize your life goals.
• Check your existing investments and the role they will play in meeting your goals and also whether the current set of investments are theright ones for you.
• Identify the right investment instruments including how much insurance and a emergency reserve should you have to take care of your dependents.
• Track and review your investments.

Do not time the market

It is advised to stay invested in the scheme and not redeem during the market crash and again invest when the markets go up because keeping track of the market and individual stocks is very a difficult job as it requires a lot of time, research and financial expertise to time the market correctly. Not all people are blessed with these abilities and face a high probability to face losses. It may happen that sometime you become over confident and take too many risks and lose your money or become overcautious and miss an opportunity.

Diversify

Your focus should be on diversifying your portfolio to protect yourself from market volatility and market downturns. Diversification is spreading your investments across the three asset classes i.e. equity, debt and gold. Then, to help offset risk even more, diversify the investments within each asset class. Keep in mind, however, that diversification doesn’t ensure a profit or guarantee against loss.

Invest through SIP

Systematic Investment Plan (SIP) is a vehicle offered by mutual funds to help investors save regularly. Systematic Investment Plans are recommended as the best way for investments in the volatile markets. With the power of “Rupee Cost Averaging”, SIPs have the potential to minimize losses and generate returns. An SIP may ensure disciplined investment irrespective of the market movement. You can invest in equities through mutual funds for as low as Rs 500 a month. That is the wonder of Systematic Investment Plans – Invest big through smallsavings. Investing through the SIP route helps you make regular investments at regular intervals and can help you gain from the benefit of compounding.

Rebalance your portfolio

At times when the market is volatile, its best to review your portfolio i.e. to check the performance of the funds in your portfolio and their exposure to risk. Be sure that you are not too over exposed to one particular sector. Some small adjustments in your portfolio might help you to give you long term profits.

You can survive the volatile markets if you are on track to meet your investment goals. Therefore, it is advised not to flow with the negative sentiments of the market during a market fluctuation and rather than focusing on the instability of the market you should focus more on how to develop a sound financial plan which will help you fight against the market volatility. However we strongly suggest you to consult with your financial advisor before proceeding with any investment decision.

Source: Quantum AMC


--

Friday, March 7, 2014

Weekly Gold

The Ukraine situation had brought out the safe-haven properties of the Gold as the Gold backed ETF's increased by 6.9 metric tons to 1,752.2 tons yesterday.  Still analysts are looking for a lower trade in the Gold next week and possibly longer-term.  The US Mint decreased sales by 66 % in February to 31,000 ounces.  Bullion demand has reached about $522 million so far this year.   The thing about the metals is you don't buy them for a fast day-trade or turn-around.  The metals are for the uncertainty, conflict, poor data and devaluation of the US Dollar.  It is for these reasons that the Gold market may lose it's luster for a time, but will shine when it is needed.  The safe haven properties remain intact as the political conflict in the Ukraine supported the Gold.  The inflows of ETF Gold holdings are up 4.5 tons in February so far.  Now the physical side of Gold may be weakened by the Chinese buyers standing aside as the price of Gold increases.  With the slack data out of China showing a bit of a slowdown, they may be absent from the Gold market for a period of time.  They are bargain hunters looking for lower price action.    There is hope that the Indian tariffs on Gold imports will lift soon but for now 10 % duties remain.  China became the biggest buyer of Gold in 2013 consuming about 1,066 tons according to the World Gold Council.  Gold imports from Hong Kong by China were about 83.6 metric tons in January.  The increase in the futures prices may have impeded the physical bullion sales this month.   Gold dipped in 2013 increasing the demand to 3,756.1 tons or about $170 billion US.  Of this, about 386.6 tons of Gold were purchased by the central banks.  Last year only seven of the top forty central banks had replenished their reserves. 

In February, 175,000 new jobs were created giving a boost to the marketplace as analysts were expecting 150,000.  The recovery looks to be on track even with the inclement weather conditions sustained over the last few months.  The data had been mixed leaving traders to ponder whether this was true weakness or a temporary weather driven theme.  Today confirmed that the Fed should stay on target with the tapering plans.  The self-sustaining growth of the US is supportive to the US Dollar and the Stock Indexes.  The uncertainty comes from two sources: The potential Russian conflict over Crimea and the data possibly coming out of China.  These two areas are strong enough fear factors to move the market even with the US in a solid recovery.   Russian President Vladimir Putin had petitioned his troops that were on the Ukraine border to return to their military installations by the end of the week confirming that his intensions were not to invade Crimea!  He sent 16,000 military to the Crimea region.   The small Black Sea region of Crimea is quite valuable in terms of resources.   Russia had actually given Crimea to the Ukraine in 1954.   The Ukraine has been in political turmoil leaving itself open and vulnerable to other countries.  The US had offered loans to the Ukraine totaling about $1 billion via financial institutions to aid with the struggling economy.  Viktor Yanukovych had been an ally to Putin and after becoming cast out from the Ukraine as President may have solicited aid from Putin.  The US had put together sanctions to penalize Russia for any overtures yesterday and the Ukraine is struggling to hold Crimea.  Crimea is vital as an access route thru the Black Sea Ports.  Now Crimea parliament votes whether to join Russia.  The European Union has condemned any action in Crimea as illegal.  The March 16th referendum may be considered to violate international law.   The US wants to uphold its voting rights with the International Monetary Fund (IMF) where they may hold more weight with global issues.  The voting rights give more power to control thru the vote, but the US owes still from a 2010 commitment which US President Obama wishes to settle.  The European Central Bank kept their interest rates unchanged at 0.25 % possibly due to stronger inflation and increased productivity!  The European Union has promised  $1.6 billion euros to the Ukraine in emergency aid.  The euro has strengthened on ECB President Draghi’s optimism regarding the Euro Zone activity.  He regards the deflation risks as easing for the moment.  Their recovery is regarded as moderate.   US Fed Chairperson Janet Yellen states that it may take months to truly evaluate the data to determine the true strength/weakness of the US economy.  Her comments may have been construed to prepare for a potential pause on the tapering progress.  So far, we have reduced the $85 billion monthly Bond purchases to $65 billion.  Her accommodative stance may have to evaluate the true nature of the employment data.  These reports are primarily surveys and may not reflect the jobless individuals that simply may have given up and retired or the younger individuals that may have moved back home and gone back to school.  Yellen states that “The recovery in the labor market is far from complete”!   What could possibly weaken this market more than anything could be slack data from China as the huge economy is often regarded as the leader in the global recovery.  China has seen a contraction in manufacturing with about $4.8 trillion in shadow banking debt to address.  The Trade Balance for China is forecast to contract to half of January’s for the month of February.   Australia looks to the Chinese economy as the trade relations remain strong between the two countries.  Actually, the trade relationships  across the globe give the global economy a fragility much like a snowball effect.  China is still viewed as a major power, but weakness can still impact the marketplace when assumed strength declines.  For now, the Chinese Prime Minister Li Keqiang projects a growth target of 7.5 %.   The next policy meeting takes place March 18th and 19th.  Yellen is known as one of the architects of the quantitative easing program that was instituted by the previous Chairman Ben Bernanke.   If the Ukraine situation should heat up and/or the Chinese data show weakness, we may look for a bounce in the Gold market.  Traders got used to selling the bounces recently.  In conflict situations or global concerns over economy, we would not sell the bounces but rather range-trade taking smaller positions.  Traders using Gold as a safe-haven element in their portfolio are averaging down with much different goals.  

Today’s Nonfarm Payrolls for February was a whopping 175,000 while the previous reading was 113,000.  The Unemployment Rate was increased to 6.7 % while the previous reading was 6.6 %.  The Average Hourly Earnings were 0.4 % while the previous reading was 0.2 %.  The Average Workweek was 34.2 hours while the previous reading was 34.4 hours.  The Private Payrolls was 162,000 while the previous reading was 142,000.  International Trade Balance Level for January was -$39.1 billion while the previous reading was -$38.7 billion.  Consumer Credit for January was $13.7 billion while the previous reading was $18.8 billion.  The US Initial Jobless Claims for the week of March 1st was down 26,000 to 323,000 while the previous reading was 348,000.  The Continuing Claims were down 8,000 to 2.907 million.  The Challenger Job-cut Report for February of announced layoffs was 41,835 while the previous reading was 45,107.  The Gallup US Payroll to Population for February was at 43.1 while the previous reading was 42.0.  Nonfarm Productivity for the Q4r:13 was 1.8 % while the previous reading was 3.2 %.  The Unit Labor Costs were -0.1 % while the previous reading was -1.6 %.    Factory Orders for January was -0.7 % while the previous reading was -1.5 %.  Chain Store Sales for February came in fairly strong considering the harsh weather conditions that kept the US or part of it in a deep freeze for an extensive time frame.  The Bloomberg Consumer Comfort Index for March was -28.5 while the previous reading was -28.6.  The ADP Employment Report for February came in at 139,000 while the previous reading was 175,000.  The PMI Services Index for February was 53.3 while the previous reading was 56.7.  The ISM Non-Manufacturing Index for February came in at 51.6 while the previous reading was 54.0.  The Gallup US Job Creation Index for February was 21 while the previous reading was 19.    The MBA Purchase Applications for the week of February 28th  Composite Index was 9.4 % while the previous reading was -8.5 %.  The Purchase Index was 9.0 % while the previous reading was -4.0 %.  The Refinance Index was 10.0 % while the previous reading was -11.0 %.  The Beige Book was out today revealing the general condition of the twelve Fed districts of the US.  It reports that eight out of the twelve districts showed modest to moderate improvement.  Retail Sales was weakened due to the weather with auto sales decreased activity.  Gradual growth showed in housing and manufacturing alike.  Any weakness was simply attributed to the inclement weather conditions.  The ICSC-Goldman Store Sales for the week of March 1st was 0.3 % while the previous reading was -0.6 %.  The Redbook Sales were at 2.9 % unchanged from the previous reading.    The Gallup US ECI was -16 unchanged from the previous reading.  The Markit’s PMI Manufacturing Index level for February was 57.1 while the previous reading was 53.7.  The ISM Manufacturing Index for February was 53.2 while the previous reading was 51.3.  Construction Spending for January was 0.1 % unchanged from the previous reading.   Domestic Motor Vehicle Sales for February was 12.2 million while the previous reading was 12.1 million.  The Total Vehicle Sales for February was 15.3 million while the previous reading was 15.2 million.   Personal Income for January was 0.3 % while the previous reading was 0.0 %.  Consumer Spending for January was 0.4 % while the previous reading was unchanged.  The PCE Price Index was 0.3 % while the previous reading was 0.2 %.   The  Core PCE Price Index for January was 0.1 % while the previous reading was unchanged.    The Gallup US Consumer Spending Measure level for February was $87 average while the previous reading was 78.  The Gross Domestic Product for Q4p:2013 Real GDP change was 2.4 % while the previous reading was 3.3 %.  The GDP Price Index was 1.6 % while the previous reading was 1.3 %.  The Chicago PMI for February was 59.8 while the previous reading was 59.6.  US Pending Home Sales for January was 95.0 up 0.1 % while the previous reading was down -8.7 % to 92.4.  The Consumer Sentiment for February was 81.6 while the previous reading was 81.2.  The US Jobless Claims for the week of February 22nd were up 14,000 to 348,000 while the previous reading was 336,000.  The Continuing Claims were up 8,000 to 2.964 million.  The Durable Goods New Orders for January were -1.0 % while the previous reading was -4.3 %.  The Durable Goods Orders excluding transportation were 1.1 % while the previous reading was -1.6 %.  The Kansas City Fed Manufacturing Index for February was 4 while the previous reading was 5.   Bloomberg Consumer Comfort Index for February was -28.6 while the previous reading was -30.6.  The New Home Sales for January level was 468,000 while the previous reading was 414,000.  The New Home Sales seem to gain traction while the existing home sales remain slack.  Definitely a bright outlook for home builders.    The MBA Purchase Applications for the week of February 21st Composite was -8.5 % while the previous reading was -4.1 %.  The Purchase Index was -4.0 % while the previous reading was -6.0 %.  The Refinance Index was -11.0 % while the previous reading was -3.0 %.  The Richmond Fed Manufacturing Index Level change for February was -6 while the previous reading was 12.  The ICSC-Goldman Store Sales for the week of February 22nd was -0.6 % while the previous reading was 2.5 %.  The Redbook Store Sales for the week of February 22nd was 2.9 % while the previous reading was 3.2 %.  The FHFA House Price Index for December was 0.8 % while the previous reading was 0.1 %.  The S&P Case-Shiller HPI for November  20-city SA was 0.8 % while the previous reading was 0.9 %.  The 20-city NSA  was -0.1 % while the previous reading was -0.1 % unchanged.  The Consumer Confidence for February was 78.1 while the previous reading was 80.7.    The State Street Investor Confidence Index for February was 123.0 while the previous reading was 114.4.  The PMI Services Flash for February was 52.7  while the previous reading was 56.6.  The Chicago Fed National Activity Index for January was -0.39 while the previous reading was 0.16.  The Dallas Fed Manufacturing Survey Business Activity Index for February was 0.3 while the previous reading was 3.8. The Production Index was 10.8 while the previous reading was 7.1. 

 
The Gold (April) contract is in sell mode if it stays below $1355.00.  It could retrace to $1290.00 depending on the Ukraine situation and the Chinese economy. 

  Gold Chart 


--

Dial ’1063′ for any telecom complaints


Telecom subscribers across the country can now register complaints by dialling a special toll free number '1063′.

A note circulated by the Department of Telecom (DoT) said a short code '1063′ has been activated by the Public Grievances Cell in the DoT headquarters in New Delhi as a telecom consumer grievances helpline.

The new number will bring subscriber grievances into the notice of DoT.

A subscriber, at present, needs to call customer care centre of the service provider to register a complaint.

Customers can go to nodal officers and then to the appellate authority in case of unsatisfactory reply.

More often than not subscribers fail to get satisfactory resolution of their grievances.

Earlier this month, DoT had had said that "District Consumer Forums are competent to deal with the disputes between individual telecom consumers and telecom service providers."

--

Lok Sabha elections to be held in 9 phases from April 7 to May 12, counting on May 16


Lok Sabha elections to be held in 9 phases from April 7 to May 12, counting on May 1610.0 out of 10 based on 2 ratings
Rating: 10.0/10 (2 votes cast)

Chief election commissioner VS Sampath announced the dates in a press conference. The two election commissioners HS Brahma and SNA Zaidi were also present.

The counting of votes to be held on May 16 and will be over in a day, Sampath told reporters.

The first date of poll shall be on April 7, 2014 which will be held in two states and six parliamentary constituencies will be covered. The second phase of poll on April 9 will cover seven constituencies in five states. The third phase on April 10 to cover 92 constituencies in 14 states and the fourth day of poll on April 12 to cover three states and five constituencies.

The fifth will be on April 17 which will cover 13 states and UTs and 122 constituencies and sixth phase will be on April 24, covering 12 states and 117 constituencies.

The seventh phase will be held on April 30 to cover nine states and 89 constituencies, eighth phase on May 7 will cover seven states and 64 constituencies and the last and ninth phase on will be on May 12 and cover 3 states and 41 constituencies.

He said that the model code of conduct has come into immediate effect. It prevents the government from making any decisions that can be seen as influencing voters. It also prohibits political parties from making unsubstantiated allegations against opponents.

He said that the total number of electorate this year stands at 81.4 crore and has increased by 10 crore as compared to the last parliamentary elections in 2009.

The chief election commissioner also said there has been a 12% increase in the number of polling stations in the country with 9,30,000 stations this year. There were 8.3 lakh stations in the last elections.

--