The Ukraine situation had brought out the safe-haven properties of the Gold as the Gold backed ETF's increased by 6.9 metric tons to 1,752.2 tons yesterday. Still analysts are looking for a lower trade in the Gold next week and possibly longer-term. The US Mint decreased sales by 66 % in February to 31,000 ounces. Bullion demand has reached about $522 million so far this year. The thing about the metals is you don't buy them for a fast day-trade or turn-around. The metals are for the uncertainty, conflict, poor data and devaluation of the US Dollar. It is for these reasons that the Gold market may lose it's luster for a time, but will shine when it is needed. The safe haven properties remain intact as the political conflict in the Ukraine supported the Gold. The inflows of ETF Gold holdings are up 4.5 tons in February so far. Now the physical side of Gold may be weakened by the Chinese buyers standing aside as the price of Gold increases. With the slack data out of China showing a bit of a slowdown, they may be absent from the Gold market for a period of time. They are bargain hunters looking for lower price action. There is hope that the Indian tariffs on Gold imports will lift soon but for now 10 % duties remain. China became the biggest buyer of Gold in 2013 consuming about 1,066 tons according to the World Gold Council. Gold imports from Hong Kong by China were about 83.6 metric tons in January. The increase in the futures prices may have impeded the physical bullion sales this month. Gold dipped in 2013 increasing the demand to 3,756.1 tons or about $170 billion US. Of this, about 386.6 tons of Gold were purchased by the central banks. Last year only seven of the top forty central banks had replenished their reserves.
In February, 175,000 new jobs were created giving a boost to the marketplace as analysts were expecting 150,000. The recovery looks to be on track even with the inclement weather conditions sustained over the last few months. The data had been mixed leaving traders to ponder whether this was true weakness or a temporary weather driven theme. Today confirmed that the Fed should stay on target with the tapering plans. The self-sustaining growth of the US is supportive to the US Dollar and the Stock Indexes. The uncertainty comes from two sources: The potential Russian conflict over Crimea and the data possibly coming out of China. These two areas are strong enough fear factors to move the market even with the US in a solid recovery. Russian President Vladimir Putin had petitioned his troops that were on the Ukraine border to return to their military installations by the end of the week confirming that his intensions were not to invade Crimea! He sent 16,000 military to the Crimea region. The small Black Sea region of Crimea is quite valuable in terms of resources. Russia had actually given Crimea to the Ukraine in 1954. The Ukraine has been in political turmoil leaving itself open and vulnerable to other countries. The US had offered loans to the Ukraine totaling about $1 billion via financial institutions to aid with the struggling economy. Viktor Yanukovych had been an ally to Putin and after becoming cast out from the Ukraine as President may have solicited aid from Putin. The US had put together sanctions to penalize Russia for any overtures yesterday and the Ukraine is struggling to hold Crimea. Crimea is vital as an access route thru the Black Sea Ports. Now Crimea parliament votes whether to join Russia. The European Union has condemned any action in Crimea as illegal. The March 16th referendum may be considered to violate international law. The US wants to uphold its voting rights with the International Monetary Fund (IMF) where they may hold more weight with global issues. The voting rights give more power to control thru the vote, but the US owes still from a 2010 commitment which US President Obama wishes to settle. The European Central Bank kept their interest rates unchanged at 0.25 % possibly due to stronger inflation and increased productivity! The European Union has promised $1.6 billion euros to the Ukraine in emergency aid. The euro has strengthened on ECB President Draghi’s optimism regarding the Euro Zone activity. He regards the deflation risks as easing for the moment. Their recovery is regarded as moderate. US Fed Chairperson Janet Yellen states that it may take months to truly evaluate the data to determine the true strength/weakness of the US economy. Her comments may have been construed to prepare for a potential pause on the tapering progress. So far, we have reduced the $85 billion monthly Bond purchases to $65 billion. Her accommodative stance may have to evaluate the true nature of the employment data. These reports are primarily surveys and may not reflect the jobless individuals that simply may have given up and retired or the younger individuals that may have moved back home and gone back to school. Yellen states that “The recovery in the labor market is far from complete”! What could possibly weaken this market more than anything could be slack data from China as the huge economy is often regarded as the leader in the global recovery. China has seen a contraction in manufacturing with about $4.8 trillion in shadow banking debt to address. The Trade Balance for China is forecast to contract to half of January’s for the month of February. Australia looks to the Chinese economy as the trade relations remain strong between the two countries. Actually, the trade relationships across the globe give the global economy a fragility much like a snowball effect. China is still viewed as a major power, but weakness can still impact the marketplace when assumed strength declines. For now, the Chinese Prime Minister Li Keqiang projects a growth target of 7.5 %. The next policy meeting takes place March 18th and 19th. Yellen is known as one of the architects of the quantitative easing program that was instituted by the previous Chairman Ben Bernanke. If the Ukraine situation should heat up and/or the Chinese data show weakness, we may look for a bounce in the Gold market. Traders got used to selling the bounces recently. In conflict situations or global concerns over economy, we would not sell the bounces but rather range-trade taking smaller positions. Traders using Gold as a safe-haven element in their portfolio are averaging down with much different goals.
Today’s Nonfarm Payrolls for February was a whopping 175,000 while the previous reading was 113,000. The Unemployment Rate was increased to 6.7 % while the previous reading was 6.6 %. The Average Hourly Earnings were 0.4 % while the previous reading was 0.2 %. The Average Workweek was 34.2 hours while the previous reading was 34.4 hours. The Private Payrolls was 162,000 while the previous reading was 142,000. International Trade Balance Level for January was -$39.1 billion while the previous reading was -$38.7 billion. Consumer Credit for January was $13.7 billion while the previous reading was $18.8 billion. The US Initial Jobless Claims for the week of March 1st was down 26,000 to 323,000 while the previous reading was 348,000. The Continuing Claims were down 8,000 to 2.907 million. The Challenger Job-cut Report for February of announced layoffs was 41,835 while the previous reading was 45,107. The Gallup US Payroll to Population for February was at 43.1 while the previous reading was 42.0. Nonfarm Productivity for the Q4r:13 was 1.8 % while the previous reading was 3.2 %. The Unit Labor Costs were -0.1 % while the previous reading was -1.6 %. Factory Orders for January was -0.7 % while the previous reading was -1.5 %. Chain Store Sales for February came in fairly strong considering the harsh weather conditions that kept the US or part of it in a deep freeze for an extensive time frame. The Bloomberg Consumer Comfort Index for March was -28.5 while the previous reading was -28.6. The ADP Employment Report for February came in at 139,000 while the previous reading was 175,000. The PMI Services Index for February was 53.3 while the previous reading was 56.7. The ISM Non-Manufacturing Index for February came in at 51.6 while the previous reading was 54.0. The Gallup US Job Creation Index for February was 21 while the previous reading was 19. The MBA Purchase Applications for the week of February 28th Composite Index was 9.4 % while the previous reading was -8.5 %. The Purchase Index was 9.0 % while the previous reading was -4.0 %. The Refinance Index was 10.0 % while the previous reading was -11.0 %. The Beige Book was out today revealing the general condition of the twelve Fed districts of the US. It reports that eight out of the twelve districts showed modest to moderate improvement. Retail Sales was weakened due to the weather with auto sales decreased activity. Gradual growth showed in housing and manufacturing alike. Any weakness was simply attributed to the inclement weather conditions. The ICSC-Goldman Store Sales for the week of March 1st was 0.3 % while the previous reading was -0.6 %. The Redbook Sales were at 2.9 % unchanged from the previous reading. The Gallup US ECI was -16 unchanged from the previous reading. The Markit’s PMI Manufacturing Index level for February was 57.1 while the previous reading was 53.7. The ISM Manufacturing Index for February was 53.2 while the previous reading was 51.3. Construction Spending for January was 0.1 % unchanged from the previous reading. Domestic Motor Vehicle Sales for February was 12.2 million while the previous reading was 12.1 million. The Total Vehicle Sales for February was 15.3 million while the previous reading was 15.2 million. Personal Income for January was 0.3 % while the previous reading was 0.0 %. Consumer Spending for January was 0.4 % while the previous reading was unchanged. The PCE Price Index was 0.3 % while the previous reading was 0.2 %. The Core PCE Price Index for January was 0.1 % while the previous reading was unchanged. The Gallup US Consumer Spending Measure level for February was $87 average while the previous reading was 78. The Gross Domestic Product for Q4p:2013 Real GDP change was 2.4 % while the previous reading was 3.3 %. The GDP Price Index was 1.6 % while the previous reading was 1.3 %. The Chicago PMI for February was 59.8 while the previous reading was 59.6. US Pending Home Sales for January was 95.0 up 0.1 % while the previous reading was down -8.7 % to 92.4. The Consumer Sentiment for February was 81.6 while the previous reading was 81.2. The US Jobless Claims for the week of February 22nd were up 14,000 to 348,000 while the previous reading was 336,000. The Continuing Claims were up 8,000 to 2.964 million. The Durable Goods New Orders for January were -1.0 % while the previous reading was -4.3 %. The Durable Goods Orders excluding transportation were 1.1 % while the previous reading was -1.6 %. The Kansas City Fed Manufacturing Index for February was 4 while the previous reading was 5. Bloomberg Consumer Comfort Index for February was -28.6 while the previous reading was -30.6. The New Home Sales for January level was 468,000 while the previous reading was 414,000. The New Home Sales seem to gain traction while the existing home sales remain slack. Definitely a bright outlook for home builders. The MBA Purchase Applications for the week of February 21st Composite was -8.5 % while the previous reading was -4.1 %. The Purchase Index was -4.0 % while the previous reading was -6.0 %. The Refinance Index was -11.0 % while the previous reading was -3.0 %. The Richmond Fed Manufacturing Index Level change for February was -6 while the previous reading was 12. The ICSC-Goldman Store Sales for the week of February 22nd was -0.6 % while the previous reading was 2.5 %. The Redbook Store Sales for the week of February 22nd was 2.9 % while the previous reading was 3.2 %. The FHFA House Price Index for December was 0.8 % while the previous reading was 0.1 %. The S&P Case-Shiller HPI for November 20-city SA was 0.8 % while the previous reading was 0.9 %. The 20-city NSA was -0.1 % while the previous reading was -0.1 % unchanged. The Consumer Confidence for February was 78.1 while the previous reading was 80.7. The State Street Investor Confidence Index for February was 123.0 while the previous reading was 114.4. The PMI Services Flash for February was 52.7 while the previous reading was 56.6. The Chicago Fed National Activity Index for January was -0.39 while the previous reading was 0.16. The Dallas Fed Manufacturing Survey Business Activity Index for February was 0.3 while the previous reading was 3.8. The Production Index was 10.8 while the previous reading was 7.1.
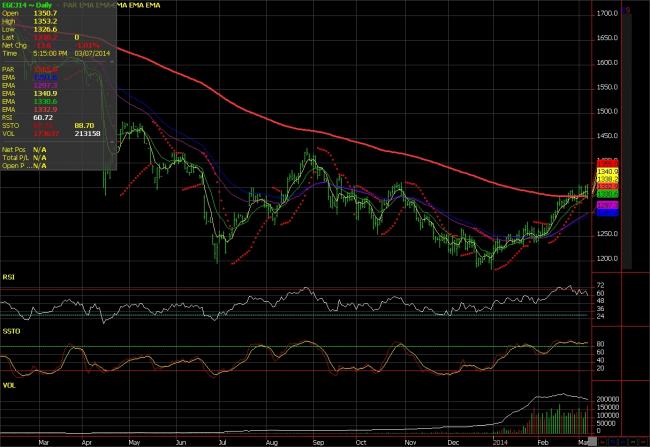
The Gold (April) contract is in sell mode if it stays below $1355.00. It could retrace to $1290.00 depending on the Ukraine situation and the Chinese economy.
Gold Chart
P.Sudeesh Kumar
p.sudeeshkumar@gmail.com
http://sudeeshbubbby7.blogspot.in
Linked in profile : n.linkedin.com/pub/sudeesh-kumar/27/3a9/307/
Follow me on twitter @Sudeeshbubby
No comments:
Post a Comment